
How It All Works: Processes & FAQs
Bringing It All Together
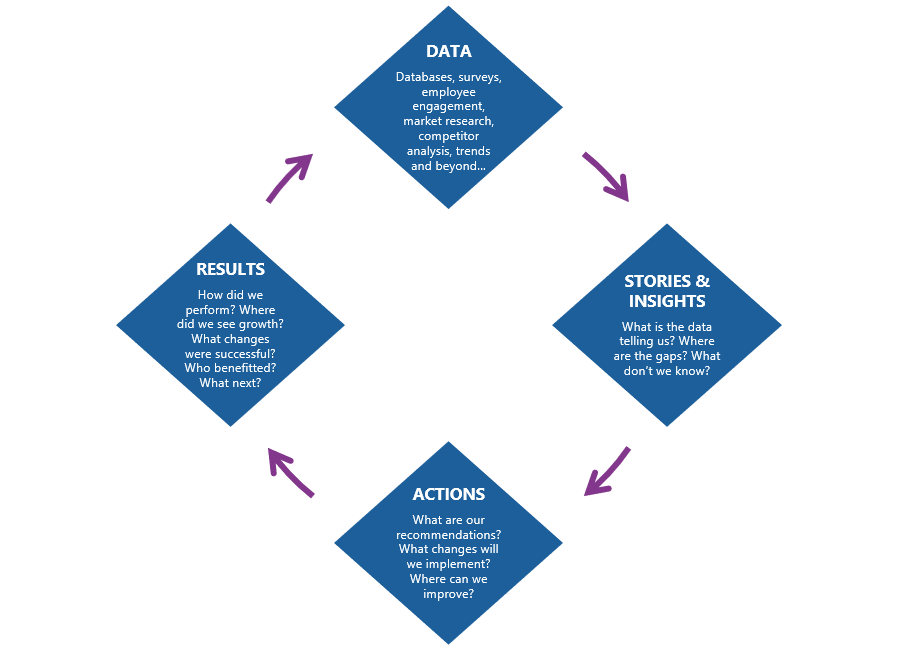
It all starts with understanding what question you're looking to answer. What assumptions are you making? What hunches need backing up? Once that's clear, we then look at the different sources of data that can help answer the question! These might be one single set (i.e., a survey), or multiple sets (survey, plus focus groups, plus interviews, for example), depending on the challenge.
This data is interrogated - where are the gaps, what trends can we see, what are we missing? And a set of actions and recommendations emerge.
Together, we'll workshop these findings for you to implement. This may be a one-off project, or it might be that this provides a benchmark that you can return to at different intervals during the year, to see how and where improvements have been made.
Shall we work out what your challenge is together?
I DON'T HAVE MUCH DATA? Can it still be 'analysed' as such?
Yes it can! And what's more, the less data you have, the more important it is to get someone impartial to look at it! You know that thing when you're too close to something? You're emotionally involved, or there are politics at play? Or perhaps you're just so close you've lost all perspective. That's where I can help - to give a view 'from afar' if you like.
WHAT ABOUT PRICING? It sounds expensive to have your data analysed by someone else...
Well, there's no such thing as a free lunch! But, I'm an expert here, so I will save you money because I can get on with it quickly, whilst you get on with what you're good at.
All of my clients are projects, rather than retainers. I price per project, depending on a number of variables including type and volume of data. Some reports can take a day or two - or it might be a project that takes 2 months. But until we have that chat, we'll never know. So don't hold back on price - it's not as costly as it sounds!
That said, I do hope that my clients will take into account my 20+ years' experience and to appreciate the value of paying for what you get.
MOST SURVEY PLATFORMS HAVE A DASHBOARD OF RESULTS. Can't I just use that?
Yes, you can and I'm not stopping you!
But dashboards (unless bespoke, of course!) will give you the headlines. My process goes much deeper to get real value from the information that's been gathered.
I will segment the data, looking at the data from different angles (i.e is there a team saying something in particular, or a geographic region with fewer responses, and so on). I will present the results back, with insights PLUS recommendations and actions. We will workshop these findings together so that you feel confident presenting them back, or making decisions from them.
As you can see, there is a lot more value here than a few pie charts on a dashboard!
HOW DO YOU SHARE YOUR FINDINGS? Will I understand it?
Absolutely! I'll present the findings back in an easy-to-follow report, in whichever format you prefer. Often, I take your company's look and feel (working to your brand guidelines), and I'll present my findings back in a report with your organisational branding. That way, you are all prepared to deliver the findings back to your team, members, clients (whoever your audience is) without wasting time re-branding and editing.
Of course, I'll share the raw datasets back for your reference too - just in case you want to have a play with a pivot table!
DO YOU USE AI SOFTWARE TO ANALYSE THE DATA?
No! I'm not a data scientist. I carry out the analysis mostly using Excel and my own processes. This way, I really dig into the detail. Doing it like this helps you spot trends and patterns as you go. It helps with the story-telling aspect. In my opinion, you can't tell the story as effectively if you haven't done the research (i.e. the data analysis in this case), because you've skipped part of the journey.
Note: this isn't meant to offend any data scientists - it's just the volume of data I'm looking at tends to be in the 10's, 100's or 1,000's - rather than the 1,000,000's!